Wireshark for Security Professionals: A Practical Student Guide, from capturing your first packet to spotting real threats on the wire.
July 5, 2026
Com 0
By Jackson Godwin. Cybersecurity Analyst & Penetration Tester .
If you are serious about a career in cybersecurity — whether as a penetration tester, SOC analyst, or network defender —Wireshark is one tool you cannot avoid learning. It is free, it is used in real enterprise environments, and it teaches you something no certification slide ever will: what actually happens on the network, packet by packet. This guide walks through what Wireshark is, why it matters for security work, and how to start using it the right way as a student building practical, job-ready skills
What Is Wireshark?
Wireshark is a free, open-source network protocol analyzer. It captures traffic flowing across a network interface and lets you inspect it packet by packet — down to individual bytes, headers, and payloads. Where a firewall log tells you “traffic was blocked,” Wireshark shows you exactly what that traffic looked like: the source, the destination, the protocol, and often the actual content being transmitted.
For security professionals, this level of visibility is priceless. Malware behaves differently on the wire than it does on disk. A misconfigured service leaks information in ways log files never capture. Wireshark turns invisible network activity into something you can see, filter, and reason about.
Why Wireshark Matters for Security Work
Incident response — reconstructing what happened during a suspected compromise by reviewing captured traffic
Penetration testing — verifying whether traffic is properly encrypted, spotting weak protocols, and confirming exploit behavior at the packet level
Threat hunting — recognizing patterns associated with malware command-and-control, data exfiltration, or lateral movement
Network troubleshooting — separating genuine security incidents from ordinary misconfigurations or performance issues
Employers consistently list packet analysis as a core skill for SOC analyst, network security, and penetration testing roles. It is one of the fastest ways to prove you understand networking fundamentals rather than just memorizing them.
Getting Started: Your First Capture
Download Wireshark from the official project site and install it with the packet-capture driver (Npcap on Windows, or the standard capture library on Linux/macOS). Once installed:
Open Wireshark and select the network interface you want to monitor (Wi-Fi or Ethernet)
Click the blue shark-fin icon to start capturing
Generate some traffic — browse a website, ping a host — then stop the capture
Scroll through the packet list to see everything that just crossed your interface
Student tip: Practice on your own home network or an isolated lab environment first. Capturing traffic on networks you do not own or have written permission to test is illegal in most jurisdictions, including under Nigeria’s Cybercrimes Act.
Understanding the Wireshark Interface
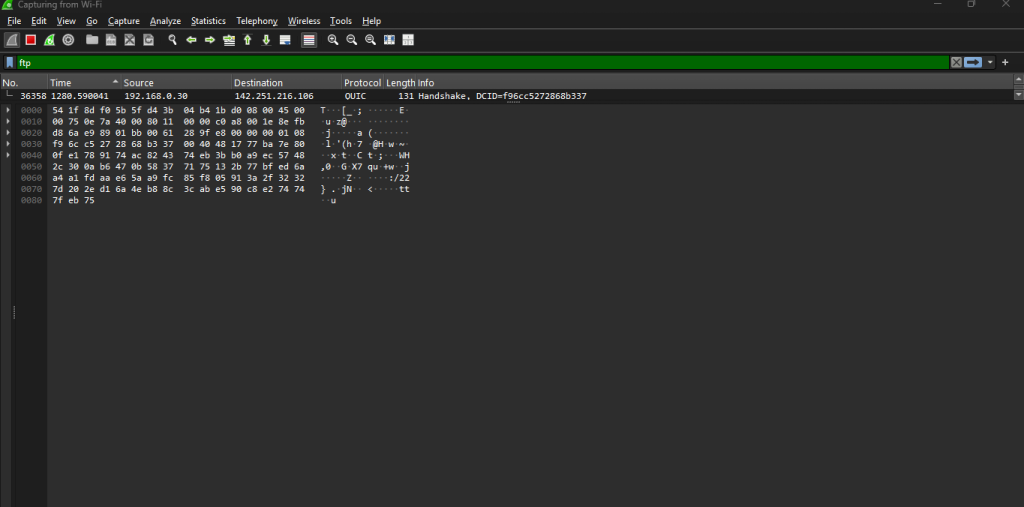
Wireshark’s window is built around three linked panels. The packet list shows every captured packet in order, with columns for time, source, destination, protocol, and a short info summary. The packet details panel breaks down whichever packet you select into its protocol layers — Ethernet, IP, TCP/UDP, and the application layer above it. The packet bytes panel shows the same packet in raw hexadecimal and ASCII, which is where you’ll spot payload content that the summary view hides.
Learning to move fluidly between these three views — summary, structure, and raw bytes — is what separates someone who “has Wireshark installed” from someone who can actually use it under pressure during an investigation.
Filters: The Real Skill Worth Mastering
Raw packet captures are noisy. A busy network can generate thousands of packets per minute, and the real skill in Wireshark is not capturing traffic — it’s filtering it down to what matters. Display filters (typed into the bar at the top of the window) are the single most valuable thing to practice as a student.
Useful filters to start with
ip.addr == 192.168.1.10 — show only traffic to or from a specific host
tcp.port == 443 — isolate HTTPS/TLS traffic
http.request — show only outgoing HTTP requests
dns — isolate DNS queries and responses, often useful for spotting malware beaconing
tcp.flags.syn == 1 && tcp.flags.ack == 0 — surface SYN packets, useful when investigating port scans
Combine filters with && (and) and || (or) to narrow in on exactly the conversation you’re investigating. This is a skill that only improves with repetition — build a personal library of filters as you practice.
Practical Use Cases for Security Professionals
1. Spotting Unencrypted Traffic
One of the most common findings in a VAPT engagement is sensitive data traveling in plaintext. Filtering for http.request or ftp will quickly reveal whether credentials, session tokens, or personal data are being sent without TLS — a finding that belongs directly in your penetration test report.
2. Investigating Suspicious DNS Activity
Many malware families communicate with command-and-control servers through DNS. Filtering on dns and reviewing query patterns — unusual domains, high query frequency, or requests to domains generated by algorithms — can be an early indicator of compromise worth escalating.
3. Analyzing TLS Handshakes Without Breaking Encryption
You don’t need to decrypt traffic to learn from it. Filtering on tls.handshake will show you the negotiation process — which TLS version and cipher suite a server offers. Weak or outdated configurations show up clearly here, which is valuable evidence during a security assessment.
4. Detecting Port Scans and Reconnaissance
A flood of SYN packets to sequential ports on a host is a classic reconnaissance signature. Combining source-IP filters with TCP flag filters lets you confirm — and time-stamp — scanning activity during an incident review.
5. Following a Full Conversation
Right-click any packet and choose “Follow → TCP Stream” to reconstruct an entire conversation between two hosts in readable form. This is often the fastest way to understand what actually happened in a suspicious session, rather than reading packet-by-packet.
Common Mistakes Students Make
Most beginners run into the same handful of problems when they start out. Knowing them in advance will save you hours of frustration.
Capturing on the wrong interface — always confirm you’re capturing on the interface actually carrying the traffic you care about (Wi-Fi vs. Ethernet vs. a virtual adapter)
Trying to read every packet — with no filter applied, thousands of packets will overwhelm anyone; filter first, read second
Ignoring capture vs. display filters — capture filters limit what Wireshark records; display filters limit what you see afterward. Mixing up the syntax between the two is a common early error
Skipping the fundamentals — jumping into Wireshark without understanding the OSI model or how TCP/IP handshakes work makes every capture look like noise
Practicing on networks without authorization — even well-intentioned curiosity can cross legal lines; always use a lab you own or have explicit written permission to test
Building This Into Your Skillset
If you’re a student working toward a cybersecurity career, treat Wireshark as a lab skill, not a theory topic. Set up a small home lab — a couple of virtual machines on an isolated network — and practice generating and capturing your own traffic: web browsing, file transfers, a simple port scan with a tool like Nmap. Then sit down and read what you captured, filter by filter, until the packets stop looking like noise.
Pair this with the fundamentals of TCP/IP networking, since Wireshark rewards people who understand what “normal” traffic looks like — it’s much easier to spot an anomaly once you know the baseline.
Final Thoughts
Wireshark will not replace your firewall, your SIEM, or your judgment — but it will teach you to see the network the way an attacker or a defender needs to see it. For students and early-career professionals, that visibility is one of the fastest paths to real, demonstrable skill. Start small, practice consistently in a lab you’re authorized to test, and let your filter library grow with every capture.
About the Author
Jackson Godwin
Cybersecurity Analyst & Penetration Tester
Jackson Godwin is a Cybersecurity Analyst, Penetration Tester, and founder of Jackson Technology, a cybersecurity and data protection consulting firm based in Abuja, Nigeria. He advises banking, fintech, oil and gas, and public sector clients on VAPT, cloud security, and compliance with frameworks including ISO 27001, NDPA, and GDPR. Jackson is also affiliated with TechTrain Academy, where he supports the development of African cybersecurity professionals.